


Statistics for SSC CGL is an important topic that can help candidates score valuable marks in both Tier 1 and Tier 2 examinations. Many aspirants focus only on Arithmetic and Advanced Maths, but Statistics remains a scoring area due to its formula-based and concept-based questions. Topics such as Mean, Median, Mode, Standard Deviation, Variance, Probability, Correlation, and Regression are regularly tested in SSC CGL. For candidates targeting the Junior Statistical Officer (JSO) post, Statistics becomes even more important because a dedicated Tier 2 paper is conducted. This blog covers key concepts, practice questions, and a free PDF for effective preparation.
Basic Concept: Statistics for SSC CGL
Here we have provided the basic concept of the statistics, which include mean (average), median, mode, quartiles, deciles, and percentiles. You are strongly advised to understand the concept so that you can solve questions.

1. Mean (Average)
Definition: The Mean is what we normally call the average. It tells us the central value of the data.
Formula:
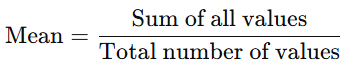
Example: Let’s say we have these numbers: 5, 10, 15, 20, 25


2. Median
Definition: The Median is the middle value when data is arranged in ascending or descending order.
- If the total numbers are odd, the median is the middle number.
- If the total numbers are even, the median is the average of the two middle numbers.
Formula: For an Odd number of terms:
Median=Middle value
(when data is sorted)
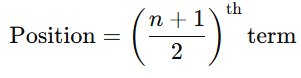
For an Even number of terms (data must be sorted):

Example 1 (Odd): Data: 3, 5, 7
→ Median = 5 (middle value)
Example 2 (Even): Data: 4, 8, 10, 12
→ Median = Average of 8 and 10 = (8 + 10)/2 = 9
3. Mode
Definition: The Mode is the number that appears most frequently in the data.
- There can be no mode, one mode, or more than one mode.
Example: Data: 2, 4, 4, 6, 8, 4, 10
→ Mode = 4 (it appears 3 times)
4. Quartiles
Definition: The Quartiles divide the data into 4 equal parts after sorting.
Types:
- Q1 (First Quartile) – 25% of the data lies below it
- Q2 (Second Quartile) – 50% below (also Median)
- Q3 (Third Quartile) – 75% below
Formula: For a data set arranged in ascending order:
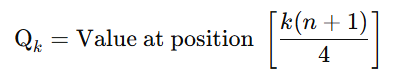
Where:
- k=1,2,3 (depending on which quartile you’re calculating)
- nnn = number of data points
Example: Data: 5, 10, 15, 20, 25, 30, 35, 40
- Q1 = 1/4th position → around 2.25th value → between 2nd (10) and 3rd (15)
→ Q1 ≈ 11.25 - Q2 = Median = Average of 4th (20) and 5th (25) → (20+25)/2 = 22.5
- Q3 = Around 6.75th position → between 6th (30) and 7th (35)
→ Q3 ≈ 33.75
5. Deciles
Definition: The Deciles divide the data into 10 equal parts.
Types:
- D1 = 10% of the data lies below it
- D5 = 50% of the data lies below it (same as Median)
- D9 = 90% of the data lies below it
Formula:

Where:
- k=1 to 9
Example: If your score is at D7, it means you scored better than 70% of people.
6. Percentiles
Definition: The Percentiles divide data into 100 equal parts.
- The k-th percentile means k% of the data is below that value.
- Common ones: 25th (Q1), 50th (Median), 75th (Q3), 90th (often used in exams).
Formula:

Where:
- k = desired percentile (1 to 99)
- n = number of data points
Example: If your marks are at the 90th percentile, it means you scored better than 90% of the students.
7. Standard Deviation (SD)
Definition: Standard Deviation measures how much the data values deviate (spread out) from the mean. A small SD means values are close to the mean; a large SD means values are spread out.
Formula (for Ungrouped Data):
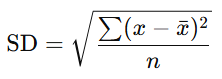
Where:
- x = each value
- x̄= mean
- n = number of values
Example: Data: 2, 4, 6
- Mean x̄ = (2+4+6)/3 = 4
- SD =

8. Variance
Definition: Variance is the square of the standard deviation. It shows how spread out the data is — but unlike SD, it’s not in original units (it’s squared).
Formula:
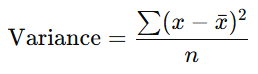
OR
Variance = (Standard Deviation)2
Example: From the previous example: SD = 1.63
So,
Variance ≈ 1.632 ≈ 2.67
9. Coefficient of Skewness
Definition: Skewness tells us about the shape of the data distribution; whether it is symmetrical, or skewed (tilted) to the left or right.
- If data is symmetrical, → skewness = 0
- If data is positively skewed → tail on the right side
- If data is negatively skewed → tail on the left side
Karl Pearson’s Coefficient of Skewness Formula:

Alternatively, if mode is not given:
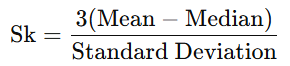
Example: Mean = 60, Median = 55, SD = 10

10. Empirical Relationship
Definition: This is a general rule connecting Mean, Median, and Mode for moderately skewed distributions.
Formula:
Mode ≈ 3 (Median) − 2 (Mean)
OR
Mean-Mode ≈ 3 (Mean−Median)
Example: If Mean = 70, Median = 60
Then,
Mode ≈ 3 (60) − 2 (70) = 180−140=40
Attempt Free Quiz on Statistics for SSC CGL 2026 Exam
Here, we have provided a free quiz on SSC CGL statistics questions. Attempt these questions and test your preparation level.
Q1. For a population of size N with population mean square S², if a sample of size n is selected using Simple Random Sampling Without Replacement (SRSWOR), what is the standard error of the sample mean?
Q2. If the two lines of regression are given by 3X + 2Y – 26 = 0 and 6X + Y – 31 = 0, what is the exact value of the correlation coefficient (r) between X and Y?
Q3. If Laspeyres’ Price Index is 144 and Paasche’s Price Index is 169, find the absolute difference between Bowley’s Price Index and Fisher’s Ideal Price Index.
Q4. The moment generating function (MGF) of a continuous random variable X is given by M(t) = (1 – 2t)^(-4). What is the variance of this random variable?
Q5. While testing the significance of the population correlation coefficient (ρ = 0) for a sample of size n drawn from a bivariate normal population, the appropriate test statistic follows a Student’s t-distribution with degrees of freedom equal to:
Q6. In a time series index numbers table, an old series with base year 2015 is spliced to a new series with base year 2022. If the old index value for the year 2024 was 160, and the old index value for the base year 2022 was 128, what is the spliced new index value for the year 2024 (taking new base 2022 = 100)?
Q7. In the Analysis of Variance (ANOVA) for a Randomized Block Design (RBD) featuring ‘v’ treatments and ‘r’ blocks, the degrees of freedom associated with the Error Sum of Squares (ESS) is calculated as:
Q8. A moderately skewed frequency distribution has a mean of 40, a median of 38, and Karl Pearson’s coefficient of skewness is 0.5. What is the variance of this distribution?
Q9. If X₁, X₂, …, Xₙ are ‘n’ independent standard normal random variables, then the random variable Y defined as the sum of squares of these variables (Y = X₁² + X₂² + … + Xₙ²) follows:
Q10. If the total correlation coefficients between three variables X₁, X₂, and X₃ are all identical and equal to 0.5 (i.e., r₁₂ = r₁₃ = r₂₃ = 0.5), what is the value of the partial correlation coefficient r₁₂.₃?
Quiz Summary
Download Free PDF of Questions on Statistics for SSC CGL
Sharpen your preparation with this free Statistics Questions PDF for SSC CGL. The PDF contains a curated set of exam-level questions along with detailed answers and step-by-step solutions to help you understand concepts, improve problem-solving skills, and practice effectively before the exam.
Why Statistics Is Important for SSC CGL 2026?
Many candidates underestimate Statistics because they focus only on Arithmetic chapters such as Percentage, Ratio, Profit and Loss, and Time and Work. However, Statistics remains an important part of SSC examinations and frequently contributes direct questions.
One of the biggest advantages of Statistics is that most questions are concept-driven. Once the formulas and concepts are clear, candidates can solve questions quickly and accurately.
Benefits of Preparing Statistics
| Benefit | Impact in Exam |
| Improves Conceptual Clarity | Helps in analytical questions |
| Formula-Based Questions | Faster solving speed |
| Useful for Tier 1 | Direct Quant questions |
| Essential for JSO | Dedicated Tier 2 paper |
| High Accuracy Potential | Lower chance of silly mistakes |
Candidates who ignore Statistics often lose easy marks that could improve their overall rank.
High-Weightage Statistics Topics for Tier 2 (JSO)
If you are appearing for Paper-II, you must master advanced analytical concepts beyond the basics. Focus your revision on these core units:
- Probability Theory & Distributions (8-10 Questions): Conditional probability, Bayes’ theorem, and probability distributions (Binomial, Poisson, Normal, and Exponential).
- Correlation & Regression (8-10 Questions): Scatter diagrams, Spearman’s rank correlation, simple correlation coefficients, and multiple/partial regression (limited to three variables).
- Measures of Central Tendency & Dispersion (16-20 Questions): Mean, median, mode, standard deviation, quartile deviations, and relative dispersion.
- Sampling Theory & Statistical Inference (12-16 Questions): Hypothesis testing (small vs. large samples), T-test, Z-test, Chi-square test, F-statistics, and types of sampling errors.
Join our exclusive Telegram group for expert guidance, personalized tips, and real-time solutions to boost your SSC exam prep. [Click here to join now!]
FAQs: Statistics for SSC CGL
What is Statistics in SSC CGL?
Statistics is a chapter within Quantitative Aptitude that includes concepts such as Mean, Median, Mode, Standard Deviation, Variance, Quartiles, Deciles, and Percentiles. It is important for both Tier 1 and Tier 2 preparation.
Is Statistics important for SSC CGL Tier 1?
Yes. SSC regularly asks Statistics-based questions in Tier 1 Quantitative Aptitude. Candidates can score easy marks if their concepts are clear.
Is there a separate Statistics paper in SSC CGL Tier 2?
Yes. Candidates applying for the Junior Statistical Officer (JSO) post must appear for a dedicated Statistics paper in Tier 2.
Which Statistics topics are most important for SSC CGL?
Mean, Median, Mode, Standard Deviation, Variance, Probability, Correlation, Regression, Sampling Theory, and Probability Distributions are among the most important topics.
What is the best way to prepare Statistics for SSC CGL?
Start with basic concepts, learn formulas thoroughly, solve previous year questions, practice topic-wise tests, and attempt mock tests regularly.
Can I prepare Statistics without a mathematics background?
Yes. Most Tier 1 Statistics questions are formula-based and can be mastered through consistent practice. Even for Tier 2 Statistics, conceptual clarity and regular question solving are more important than having an advanced mathematics background.
- Sign Up on Practicemock for Updated Current Affairs, Topic Tests and Mini Mocks
- Sign Up Here to Download Free Study Material
Free Mock Tests for the Upcoming Exams
- IBPS PO Free Mock Test
- RBI Grade B Free Mock Test
- IBPS SO Free Mock Test
- NABARD Grade A Free Mock Test
- SSC CGL Free Mock Test
- IBPS Clerk Free Mock Test
- IBPS RRB PO Free Mock Test
- IBPS RRB Clerk Free Mock Test
- RRB NTPC Free Mock Test
- SSC MTS Free Mock Test
- SSC Stenographer Free Mock Test
- GATE Mechanical Free Mock Test
- GATE Civil Free Mock Test
- RRB ALP Free Mock Test
- SSC CPO Free Mock Test
- AFCAT Free Mock Test
- SEBI Grade A Free Mock Test
- IFSCA Grade A Free Mock Test
- RRB JE Free Mock Test
- Free Banking Live Test
- Free SSC Live Test