

Statistics is one of the most popular topics that can be asked in any government exam. With the release of the SSC CGL Notification, candidates should start preparing important topics like Statistics because SSC has already asked questions from this topic in exams like SSC Stenographer and SSC Selection Post. So, you can expect questions on this topic in the SSC CGL 2025 Tier 1 exam as well. For that, we have provided this blog in which we have included questions on Statistics for SSC CGL exam based on the new exam pattern that Eduquity is asking. You are strongly advised to attempt these questions so that you can understand the types of questions that can be asked in the exam from this topic. Along with that, you can attempt our free preparation resources so that you can prepare for the exam more effectively.
Basic Concept: Statistics for SSC CGL
Here we have provided the basic concept of the statistics, which include mean (average), median, mode, quartiles, deciles, and percentiles. You are strongly advised to under the concept so that you can solve questions.

1. Mean (Average)
Definition: The Mean is what we normally call the average. It tells us the central value of the data.
Formula:
Example: Let’s say we have these numbers: 5, 10, 15, 20, 25
2. Median
Definition: The Median is the middle value when data is arranged in ascending or descending order.
- If the total numbers are odd, the median is the middle number.
- If the total numbers are even, the median is the average of the two middle numbers.
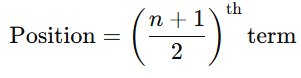
Formula: For an Odd number of terms:
Median=Middle value
(when data is sorted)
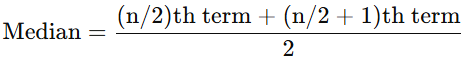
For an Even number of terms (data must be sorted):
Example 1 (Odd): Data: 3, 5, 7
→ Median = 5 (middle value)
Example 2 (Even): Data: 4, 8, 10, 12
→ Median = Average of 8 and 10 = (8 + 10)/2 = 9

3. Mode
Definition: The Mode is the number that appears most frequently in the data.
- There can be no mode, one mode, or more than one mode.
Example: Data: 2, 4, 4, 6, 8, 4, 10
→ Mode = 4 (it appears 3 times)
4. Quartiles
Definition: The Quartiles divide the data into 4 equal parts after sorting.
Types:
- Q1 (First Quartile) – 25% of the data lies below it
- Q2 (Second Quartile) – 50% below (also Median)
- Q3 (Third Quartile) – 75% below
Formula: For a data set arranged in ascending order:
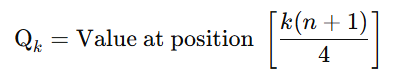
Where:
- k=1,2,3 (depending on which quartile you’re calculating)
- nnn = number of data points
Example: Data: 5, 10, 15, 20, 25, 30, 35, 40
- Q1 = 1/4th position → around 2.25th value → between 2nd (10) and 3rd (15)
→ Q1 ≈ 11.25 - Q2 = Median = Average of 4th (20) and 5th (25) → (20+25)/2 = 22.5
- Q3 = Around 6.75th position → between 6th (30) and 7th (35)
→ Q3 ≈ 33.75
5. Deciles
Definition: The Deciles divide the data into 10 equal parts.
Types:
- D1 = 10% of the data lies below it
- D5 = 50% of the data lies below it (same as Median)
- D9 = 90% of the data lies below it
Formula:
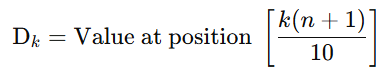
Where:
- k=1 to 9
Example: If your score is at D7, it means you scored better than 70% of people.
6. Percentiles
Definition: The Percentiles divide data into 100 equal parts.
- The k-th percentile means k% of the data is below that value.
- Common ones: 25th (Q1), 50th (Median), 75th (Q3), 90th (often used in exams).
Formula:
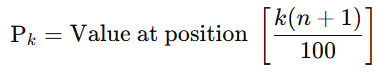
Where:
- k = desired percentile (1 to 99)
- n = number of data points
Example: If your marks are at the 90th percentile, it means you scored better than 90% of the students.
7. Standard Deviation (SD)
Definition: Standard Deviation measures how much the data values deviate (spread out) from the mean. A small SD means values are close to the mean; a large SD means values are spread out.
Formula (for Ungrouped Data):
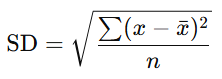
Where:
- x = each value
- x̄= mean
- n = number of values
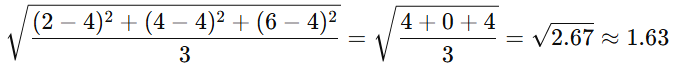
Example: Data: 2, 4, 6
- Mean x̄ = (2+4+6)/3 = 4
- SD =
8. Variance
Definition: Variance is the square of the standard deviation. It shows how spread out the data is — but unlike SD, it’s not in original units (it’s squared).
Formula:
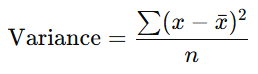
OR
Variance = (Standard Deviation)2
Example: From the previous example: SD = 1.63
So,
Variance ≈ 1.632 ≈ 2.67
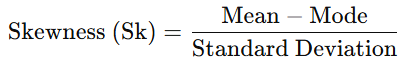
9. Coefficient of Skewness
Definition: Skewness tells us about the shape of the data distribution; whether it is symmetrical, or skewed (tilted) to the left or right.
- If data is symmetrical, → skewness = 0
- If data is positively skewed → tail on the right side
- If data is negatively skewed → tail on the left side
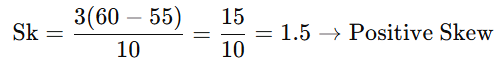
Karl Pearson’s Coefficient of Skewness Formula:
Alternatively, if mode is not given:
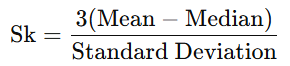
Example: Mean = 60, Median = 55, SD = 10
10. Empirical Relationship
Definition: This is a general rule connecting Mean, Median, and Mode for moderately skewed distributions.
Formula:
Mode ≈ 3 (Median) − 2 (Mean)
OR
Mean-Mode ≈ 3 (Mean−Median)
Example: If Mean = 70, Median = 60
Then,
Mode ≈ 3 (60) − 2 (70) = 180−140=40
Statistics Questions for SSC CGL: Download Free PDF
Hope you have understood the statistics and its basic concept. Now, you should practice some questions so that you can understand statistics more deeply. Here we have provided some statistics questions for SSC CGL exam, based on the new pattern that SSC can ask in the SSC CGL Tier 1 exam. Along with that, we have provided a PDF in which you will get detailed solutions for these questions. Try to solve these questions first by yourself, and then download the PDF for solutions.
Question 1: Find the mode of a given set of observations whose mean and median is 12 and 36, respectively.
A) 80
B) 84
C) 72
D) 80
Question 2: Given below is the weight (in kg) of 5 different goats. Find the variance of the given data.
Weight: 12, 15, 8, 20, 10
A) 22.4
B) 17.6
C) 19.2
D) 12.8
Question 3: Find the difference between the range and median of the given set X = {20, 13, 26, 14, 12, 46, 21, 28, 32}
A) 20
B) 17
C) 13
D) 21
Question 4: The data given below shows the weight (in kg) of 6 different students:
45, 62, x, 40, 37, 71
If the arithmetic mean of the weight of the 6 students is 52 kg, then find the median weight of the 6 students.
A) 52 kg
B) 55 kg
C) 49 kg
D) 51 kg
Question 5: Find the sample standard deviation of the data given below:
2, 2, 4, 7, 5, 2, 7, 5, 2, 4
A) 2
B) 5
C) 3
D) 4
Question 6: The given table shows the number of people in different age groups. Find the mean age of the given number of people.
| Class interval of age (in years) | Number of people (f) |
| 25 – 29 | 10 |
| 30 – 34 | 12 |
| 35 – 39 | 8 |
| 40 – 44 | 5 |
| 45 – 49 | 15 |
| 50 – 54 | 10 |
| 55 – 59 | 15 |
A) 43.2
B) 42.4
C) 49.2
D) 45.6
Question 7: If mean x̄ = 50, standard deviation σ = 25, then coefficient of variation will be
A) 200%
B) 50%
C) 25%
D) None of these
Question 8: The data given below shows the marks scored by 6 different students in an exam:
56, 60, 35, 73, 92, 44
Find the difference between the arithmetic mean and median of the given data.
A) 5
B) 2
C) 3
D) 0
Question 9: Find the mode of the given data.
12, 14, 13, 12, 6, 13, 8, 3, 13, 12, 14, 12, 6
A) 14
B) 13
C) 12
D) 6
Question 10: Find the mode for the given distribution (rounded off to two decimal places).
| Class Interval | 5 – 10 | 10 – 15 | 15 – 20 | 20 – 25 | 25 – 30 | 30 – 35 |
| Frequency | 8 | 7 | 6 | 9 | 11 | 10 |
A) 35.25
B) 40.25
C) 30.33
D) 28.33
Additional Resources for SSC CGL 2025 Exam Preparation
Just don’t focus only on solving the statistics questions. If you want to crack the CGL Tier 1 exam effectively, then you should focus on each topic or section. After practicing Statistics questions topic-wise, candidates should attempt the SSC CGL Mock Test to check their complete Quantitative Aptitude preparation, improve speed, and build exam-level accuracy. Here we have provided some free preparation resources that will help you in your revision and exam preparation. You are strongly advised to attempt these resources and increase your chances of scoring good marks.
| Click for Mock Test -> | SSC CGL Free Full-Length Mock Test |
| Click for SSC CA -> | SSC CGL Free Weekly Current Affairs Tests |
| Click for Quant -> | Quantitative Aptitude Free Topic Tests |
| Click for Reasoning -> | General Reasoning Free Topic Tests |
| Click for English -> | English Comprehension Free Topic Tests |
| Click for SSC GA -> | General Awareness Free Topic Tests |
| Click for Sectional Mock Tests -> | SSC CGL Free Sectional Mock Tests |
| Click for PYQs -> | Free SSC CGL Previous Year Question Papers |
Candidates preparing for data interpretation and calculation-based chapters should also regularly follow the SSC CGL Exam Date so they can allocate dedicated time for Statistics practice, revision of formulas, and mock test attempts before the examination.

Join our exclusive Telegram group for expert guidance, personalized tips, and real-time solutions to boost your SSC exam prep. [Click here to join now!]
| Other Blogs of SSC CGL 2025 | |
| SSC CGL Notification | SSC CGL Syllabus |
| SSC CGL Study Plan | SSC CGL Exam Pattern |
| SSC CGL Cut Off | SSC CGL Preparation Strategy |
| SSC CGL Previous Year Question Papers | |
FAQs: Statistics for SSC CGL
Statistics is a part of the Quant section involving data analysis like mean, median, mode, etc.
Key topics include Mean, Median, Mode, Quartiles, Deciles, Percentiles, SD, Variance, Skewness, etc.
You can get the statistics questions for SSC CGL exam level in this blog.
Understand concepts clearly and practice mock tests and PYQs regularly.
- Sign Up on Practicemock for Updated Current Affairs, Topic Tests and Mini Mocks
- Sign Up Here to Download Free Study Material
Free Mock Tests for the Upcoming Exams
- IBPS PO Free Mock Test
- RBI Grade B Free Mock Test
- IBPS SO Free Mock Test
- NABARD Grade A Free Mock Test
- SSC CGL Free Mock Test
- IBPS Clerk Free Mock Test
- IBPS RRB PO Free Mock Test
- IBPS RRB Clerk Free Mock Test
- RRB NTPC Free Mock Test
- SSC MTS Free Mock Test
- SSC Stenographer Free Mock Test
- GATE Mechanical Free Mock Test
- GATE Civil Free Mock Test
- RRB ALP Free Mock Test
- SSC CPO Free Mock Test
- AFCAT Free Mock Test
- SEBI Grade A Free Mock Test
- IFSCA Grade A Free Mock Test
- RRB JE Free Mock Test
- Free Banking Live Test
- Free SSC Live Test