

Line Graph Data Interpretations for IBPS PO: Data Interpretation (DI) is a crucial segment in the Quantitative Aptitude section of the IBPS PO 2025 exam, and Line Graph DI is one of the most commonly asked formats. For candidates preparing for the IBPS PO 2025 exam, mastering line graph data interpretation is essential to secure high marks in both the Prelims and Mains examinations. This article provides an in-depth exploration of line graph data interpretations, along with the strategies, examples, and tips to solve DI questions easily.
What is Line Graph Data Interpretation?
A line graph displays information as a series of data points (“markers”) connected by straight line segments. In DI sets, line graphs are used to compare trends across multiple categories (e.g., years, companies, cities, months).

IBPS PO 2025 Quantitative Aptitude: DI Weightage
Data Interpretation (DI) forms the bulk of the Quantitative Aptitude section in the IBPS PO Prelims and Mains:
Prelims (35 Questions – 30 Marks)
- DI weightage: 10–15 questions
- Types: Line Graph, Bar Graph, Pie Chart, Caselet, Tabular
Mains (35 Questions – 50 Marks)
- DI weightage: 15–20 questions
- Advanced DI: Line Graphs combined with Arithmetic, Quadratic DI, Mixed Graphs
Line Graphs often appear as:
- Simple Line Graphs
- Dual Line Graphs
Sign up now to access study resources based on the latest exam pattern
Get free full-length mock tests, topic-wise tests, mini mock tests, and papers from the previous year. Boost your score with Special Rank Booster sets. Don’t miss out — start your smart preparation today!


Types of Line Graph DI Questions
Understanding the structure of different line graph types is key to mastering them. Here are the most common types you’ll find in IBPS PO 2025:
1 Single-Line Graph
- One line showing variation (e.g., profit over years)
- Used in simpler sets
2️ Double-Line Graph
- Two lines showing comparative data (e.g., income vs. expenditure)
- Common in both Prelims and Mains
3️ Multi-Line Graph
- 3–4 lines representing different categories (e.g., sales of four companies across 6 months)
4 Conceptual Line Graph
- In Mains: Based on concepts like average, profit-loss, SI-CI, percentage etc.
Most Important Line Graph Questions for IBPS PO 2025 Exam
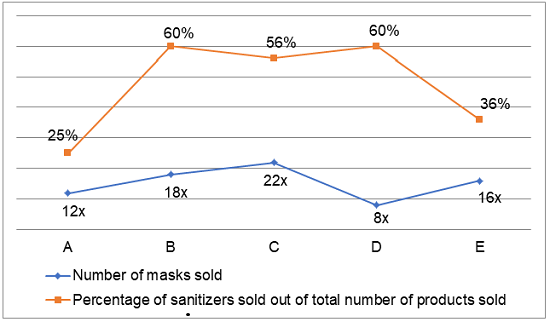
Question 1: Find the ratio of the number of sanitizers sold by ‘B’ to the total number of products sold by ‘E’.
A) 17:15
B) 9:7
C) 27:25
D) 31:29
E) 23:21
Question 2: Find the average number of masks sold by ‘A’, ‘D’ and ‘E’.
A) 300
B) 240
C) 320
D) 210
E) 360
Question 3: The number of masks sold by ‘B’ is how much percent more/less than the number of sanitizers sold by ‘D’?
A) 30%
B) 25%
C) 60%
D) 40%
E) 50%
Question 4: Find the difference between total number of products sold by ‘C’ and that by ‘A’.
A) 480
B) 560
C) 740
D) 850
E) 600
Question 5: If the cost of each mask sold by ‘E’ is Rs. 50 and each sanitizer sold by ‘B’ is Rs. 40, then find the sum of the revenue generated by ‘B’ and ‘E’ by selling sanitizers and masks respectively.
A) Rs. 47000
B) Rs. 36000
C) Rs. 32000
D) Rs. 45000
E) Rs. 54000
IBPS PO Super Special Mock Test Challenge 2025 Link- 5 Days 5 Mock
Get ready to boost your IBPS PO 2025 preparation with the IBPS PO Super Special mock test Challenge! This special online challenge offers 5 full-length mock tests in 5 days, designed keeping in mind the real exam environment. This is a rank booster initiative that will help you assess your current level, improve speed and accuracy, and move up the merit list.
Don’t miss this final prep push!
| Day 1 | Mock 1 (Easy Level) |
| Day 2 | Mock 2 (Easy Leve) |
| Day 3 | Mock 3 (Moderate Level) |
| Day 4 | Mock 4 (Moderate Level) |
| Day 5 | Mock 5 (Difficult Level) |
Quant Test Series
| IBPS PO Quant Tests Series | |
| Quant Topic Tests | Attempt Now |
| Quant Mini Mock Tests | Attempt Now |
| Quant Sectional Mock Tests | Attempt Now |
| Full-length Mock Test | Attempt Now |
Reasoning Test Series
| IBPS PO Reasoning Tests Series | |
| Reasoning Topic Tests | Attempt Now |
| Reasoning Mini mock Tests | Attempt Now |
| Reasoning Sectional Mock Tests | Attempt Now |
| Full-length Mock Test | Attempt Now |
English Test Series
| IBPS PO English Tests Series | |
| English Topic Tests | Attempt Now |
| English Mini Mock Tests | Attempt Now |
| English Sectional Mock Tests | Attempt Now |
| Full-length Mock Test | Attempt Now |
Strategies to Solve Line Graph Questions
To excel in line graph data interpretation for IBPS PO 2025, candidates must adopt a strategic approach. Below are proven strategies to tackle these questions efficiently:
1. Understand the Graph Thoroughly
- Read the Title and Labels: The title of the line graph provides context (e.g., “Sales of Companies A, B, and C from 2019 to 2023”). Check the X-axis and Y-axis labels to understand the variables and units (e.g., years, revenue in lakhs).
- Identify Trends: Quickly scan the graph to identify upward or downward trends, peaks, troughs, or anomalies.
- Multiple Lines: If the graph has multiple lines, note which line corresponds to which dataset (e.g., Company A, Company B).
2. Practice Quick Calculations
- Line graph questions often involve calculations like percentages, ratios, and averages. Strengthen your mental math skills to perform these quickly.
- Use approximations for complex calculations to save time, especially in Prelims.
- Memorise common fraction-to-percentage conversions (e.g., 1/4 = 25%, 1/3 = 33.33%) to simplify percentage-based questions.
3. Prioritise Easier Questions
- Start with questions that require direct value extraction or simple comparisons, as they are less time-consuming.
- Tackle multi-step or percentage-based questions after building confidence with easier ones.
4. Use Shortcuts and Tricks
- For ratios, simplify values to their lowest terms to avoid errors.
- For averages, sum the values and divide by the number of data points.
5. Practice with Mock Tests
- Regular practice with mock tests and previous years’ papers helps familiarize you with the question patterns and improves speed.
- Analyse your performance to identify weak areas and focus on them during preparation.
6. Manage Time Effectively
- In Prelims, allocate about 1-1.5 minutes per question in the Quantitative Aptitude section.
- In Mains, where DI questions are more complex, aim for 2-3 minutes per question in the Data Analysis and Interpretation section.
- Skip time-consuming questions and return to them if time permits.
Join our exclusive Telegram group where our experts are ready to answer all your queries, guide you in banking exam preparation, and give personalised tips to boost your success. Get access to real-time solutions, expert advice, and valuable resources to improve your study journey. [Click here to join now!]
Also Read

- Sign Up on Practicemock for Updated Current Affairs, Topic Tests and Mini Mocks
- Sign Up Here to Download Free Study Material
Free Mock Tests for the Upcoming Exams
- IBPS PO Free Mock Test
- RBI Grade B Free Mock Test
- IBPS SO Free Mock Test
- NABARD Grade A Free Mock Test
- SSC CGL Free Mock Test
- IBPS Clerk Free Mock Test
- IBPS RRB PO Free Mock Test
- IBPS RRB Clerk Free Mock Test
- RRB NTPC Free Mock Test
- SSC MTS Free Mock Test
- SSC Stenographer Free Mock Test
- GATE Mechanical Free Mock Test
- GATE Civil Free Mock Test
- RRB ALP Free Mock Test
- SSC CPO Free Mock Test
- AFCAT Free Mock Test
- SEBI Grade A Free Mock Test
- IFSCA Grade A Free Mock Test
- RRB JE Free Mock Test
- Free Banking Live Test
- Free SSC Live Test