

Pie Chart-based Data Interpretation (DI) is one of the most commonly asked topics in the SBI PO exam. It consists of questions where data is represented in a circular chart format, making it easier to compare parts of a whole. In the SBI PO Prelims and Mains exams, DI questions, especially pie charts, carry high weightage and are almost always included. So, you simply can’t skip this topic. To help you solve it, we’ve created a free PDF with questions, solutions, and tips to strengthen your DI preparation for SBI PO 2025.
As per the latest SBI PO Notification, the exam pattern continues to include high-weightage Data Interpretation topics like Pie Charts, making it an essential area for both Prelims and Mains preparation.
What is Pie Chart DI?
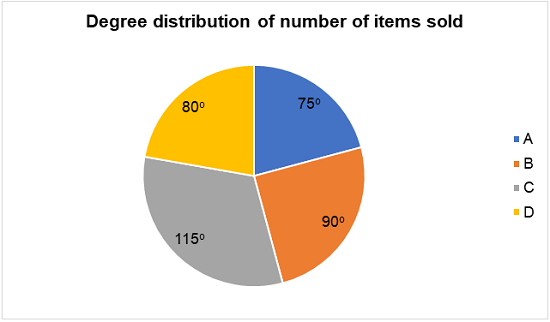
Pie Chart-based Data Interpretation (DI) is one of the most commonly asked question types in bank exams like SBI PO. It involves analyzing data represented in circular graphs divided into sectors (percentages or angles) and answering related questions. These questions test your ability to calculate ratios, percentages, and averages with accuracy and speed.

Importance of PIE Chart DI SBI PO Bank Exam
Pie Chart DI holds significant weightage in both Prelims and Mains of the SBI PO exam, especially in the Data Interpretation section of Quant. In almost every Mains paper, one or two pie charts are present. You simply can’t afford to skip this topic if you’re serious about clearing SBI PO. It’s a high-scoring area once you understand the fundamentals and practice well.
SBI PO Exam 2025 All-in-One Prep Kit (Based On Latest Pattern)
The SBI PO All-in-One Prep Kit is a comprehensive study package designed to help students prepare effectively and pass the SBI PO exam with confidence. It includes everything you need to study, such as full mock tests, topic-wise practice questions, section-wise quizzes, previous years’ papers, current affairs PDFs, and a special rank booster, all available in one place for easy access.


PIE Chart DI SBI PO 2025 Important Questions
Most expected questions that can come in SBI PO 2025. Here are a few questions of how questions have been asked in the exam. Have a look
Directions: Answer the questions based on the information given below.
The following pie charts show the percentage distribution of the number of students in five different streams in a college. Number of students in EIC is 800.
Question 1: If the number of male students in EE stream is equal to the average of number of students in ECE and EE stream then how much percent of students in the EE stream are females?
A) 9%
B) 6%
C) 12%
D) 8%
E) None of these
Question 2: If the number of students in CE stream is 100 more than the number of students in EIC stream then find the ratio of the number of students in CE stream to that in ME stream.
A) 1:2
B) 3:2
C) 4:7
D) 5:7
E) 7:11
Question 3: The number of students in IT stream is 576 out of which 25% are females. If the number of female students in IT stream is 24 more than that in CSE stream then find the number of male students in CSE stream.
A) 700
B) 750
C) 600
D) 850
E) 550
Question 4: If 45% of number of students in EE stream are males and 25% of number of students in ME stream are females then find the average of number of male students in EE and ME streams.
A) 400
B) 250
C) 300
D) 350
E) 450
Question 5: If the number of students in AI stream is 50% of the number of students in ECE stream then find the sum of the number of students in AI stream and CSE stream.
A) 1120
B) 1140
C) 1160
D) 1180
E) None of these
PIE Chart DI SBI PO Questions PDF
PIE Chart DI for SBI PO Exam, Get PDF by Clicking on the Link Below:
SBI PO Mock Test Challenge 2025
SBI PO Mock Test Challenge 2025 is a structured and competitive test designed to mirror the real exam environment. PracticeMock provides a mock test series with the latest pattern and syllabus for prelims and mains exams. Here we are providing the SBI PO mock test challenge link along with the detailed analysis. Candidates click the link below and attempt all mock tests and topic tests.
| Task 1 | Task 2 |
| SBI PO Prelims 2025 Free Mock Test | Mock Test 1 |
| SBI PO Quant, Reasoning & English Topic Tests | Mock Test 2 |
| Mini Mock Tests | Mock Test 3 |
| Sectional Tests | Mock Test 4 |
| Previous Year Paper | Mock Test 5 |
Tips to Solve Pie Chart DI Questions (SBI PO Level)
1. Understand the Base Value
- Always start by identifying the total value given (e.g., total number of students).
- In the above questions, the number of students in EIC = 800. This helps you find the actual values for other streams based on percentages.
2. Convert Percentages to Actual Values
- Use the pie chart percentage to calculate the actual number of students:
- Example: If EIC = 800 and it represents 20%, then total students = 800 ÷ 20% = 4000.
- Then use: Actual number = (Given percentage × Total students) ÷ 100
- Example: If EIC = 800 and it represents 20%, then total students = 800 ÷ 20% = 4000.
3. For Ratio-Based Questions
- Once you find the actual number of students in the respective streams, directly form the ratio.
- Simplify it carefully to avoid silly mistakes.
4. For Gender-Based Questions
- If percentages of male or female students are given:
- Male = Total × % of males
- Female = Total − Male (or vice versa)
- Male = Total × % of males
- In some cases, you’re given gender count in one stream and asked to compare with another—read carefully.
5. For Averages
- Add the required quantities and divide by the number of items.
- Example: If male students in EE = 360 and in ME = 240, then average = (360 + 240) ÷ 2 = 300
- Example: If male students in EE = 360 and in ME = 240, then average = (360 + 240) ÷ 2 = 300
6. For Missing Stream Values
- Sometimes, you’re given an indirect number (e.g., “IT has 576 students”) and asked to find the percentage or compare with another stream.
- Always plug in real numbers based on the question, even if not directly from the pie chart.
7. Avoid Calculating Everything
- Look at the options if only one answer is close to your estimate, save time by eliminating wrong options.
- Don’t waste time finding exact values if approximation works.
8. Use Shortcuts for Percentages
- Memorize common percentage-to-fraction conversions (e.g., 25% = ¼, 50% = ½, etc.)
- This speeds up your calculation significantly during the exam.
Join our exclusive Telegram group where our experts are ready to answer all your queries, guide you in banking exam preparation, and give personalised tips to boost your success. Get access to real-time solutions, expert advice, and valuable resources to improve your study journey. [Click here to join now!]
Other Related Blogs on SBI PO 2026
| Related Articles | ||
| SBI PO Notification | SBI PO Syllabus | SBI PO Exam Date |
| SBI PO Eligibility Criteria | SBI PO Salary | SBI PO Cut Off |
| SBI PO Result | SBI PO Exam 2026 Prep | SBI PO PYQs |
| SBI PO Study Plan 2025 | ||

- Sign Up on Practicemock for Updated Current Affairs, Topic Tests and Mini Mocks
- Sign Up Here to Download Free Study Material
Free Mock Tests for the Upcoming Exams
- IBPS PO Free Mock Test
- RBI Grade B Free Mock Test
- IBPS SO Free Mock Test
- NABARD Grade A Free Mock Test
- SSC CGL Free Mock Test
- IBPS Clerk Free Mock Test
- IBPS RRB PO Free Mock Test
- IBPS RRB Clerk Free Mock Test
- RRB NTPC Free Mock Test
- SSC MTS Free Mock Test
- SSC Stenographer Free Mock Test
- GATE Mechanical Free Mock Test
- GATE Civil Free Mock Test
- RRB ALP Free Mock Test
- SSC CPO Free Mock Test
- AFCAT Free Mock Test
- SEBI Grade A Free Mock Test
- IFSCA Grade A Free Mock Test
- RRB JE Free Mock Test
- Free Banking Live Test
- Free SSC Live Test