


For policymakers tracking India’s labour market, the March 2026 PLFS bulletin offers more than a headline number. Yes, unemployment edged up to 5.1%, but the real story lies beneath—urban joblessness rising, female participation slipping, and youth unemployment climbing. These shifts reveal structural fragilities that a single percentage point cannot capture. Is India facing a temporary softening, or a deeper employment mismatch? In this Vishleshan, we decode the March data, unpack three hidden layers of concern, and outline the reforms India’s labour market urgently needs.
India’s unemployment rate edges up to 5.1% in March as urban joblessness rises
- Context: India’s cities have been among the brightest spots in its post-pandemic economic recovery — but March 2026 sent a quieter signal. The latest PLFS Monthly Bulletin shows that urban hiring is softening, women are stepping back from the workforce, and the labour market’s ability to absorb job seekers is weakening. This Mint article argues that the overall picture is not alarming, but it is no longer as comfortable as it was — and the stress is coming from where it hurts most: cities, women, and young workers.
| Link to the Article: Mint |
PLFS- India’s Official Labour Market Thermometer
- The Periodic Labour Force Survey is India’s primary official instrument for measuring employment and unemployment, conducted by the National Statistical Office (NSO) under MoSPI.
- Before PLFS was launched in 2017, India relied on the NSSO’s Employment-Unemployment Survey — conducted only once every five years — making it practically useless for tracking near-term trends.
- Since January 2025, a revised methodology now provides monthly and quarterly estimates.
- The monthly bulletin uses the Current Weekly Status (CWS) approach, which classifies a person as employed or unemployed based on their activity during the seven days preceding the survey date — making it sensitive to short-term fluctuations.
What Does PLFS Measure?
The PLFS monthly bulletin tracks three indicators that together tell the complete labour-market story — not just whether people are unemployed, but whether they are even looking for work.
| Indicator | What It Measures | February 2026 | March 2026 |
| Unemployment Rate (UR) | Share of labour force without work | 4.9% | 5.1% |
| Labour Force Participation Rate (LFPR) | Share of population working or seeking work | 55.9% | 55.4% |
| Worker Population Ratio (WPR) | Share of population actually employed | 53.2% | 52.6% |
When the LFPR also falls alongside rising unemployment, it signals discouraged worker withdrawal — people have stopped looking for work altogether — making the situation worse than the unemployment headline suggests.
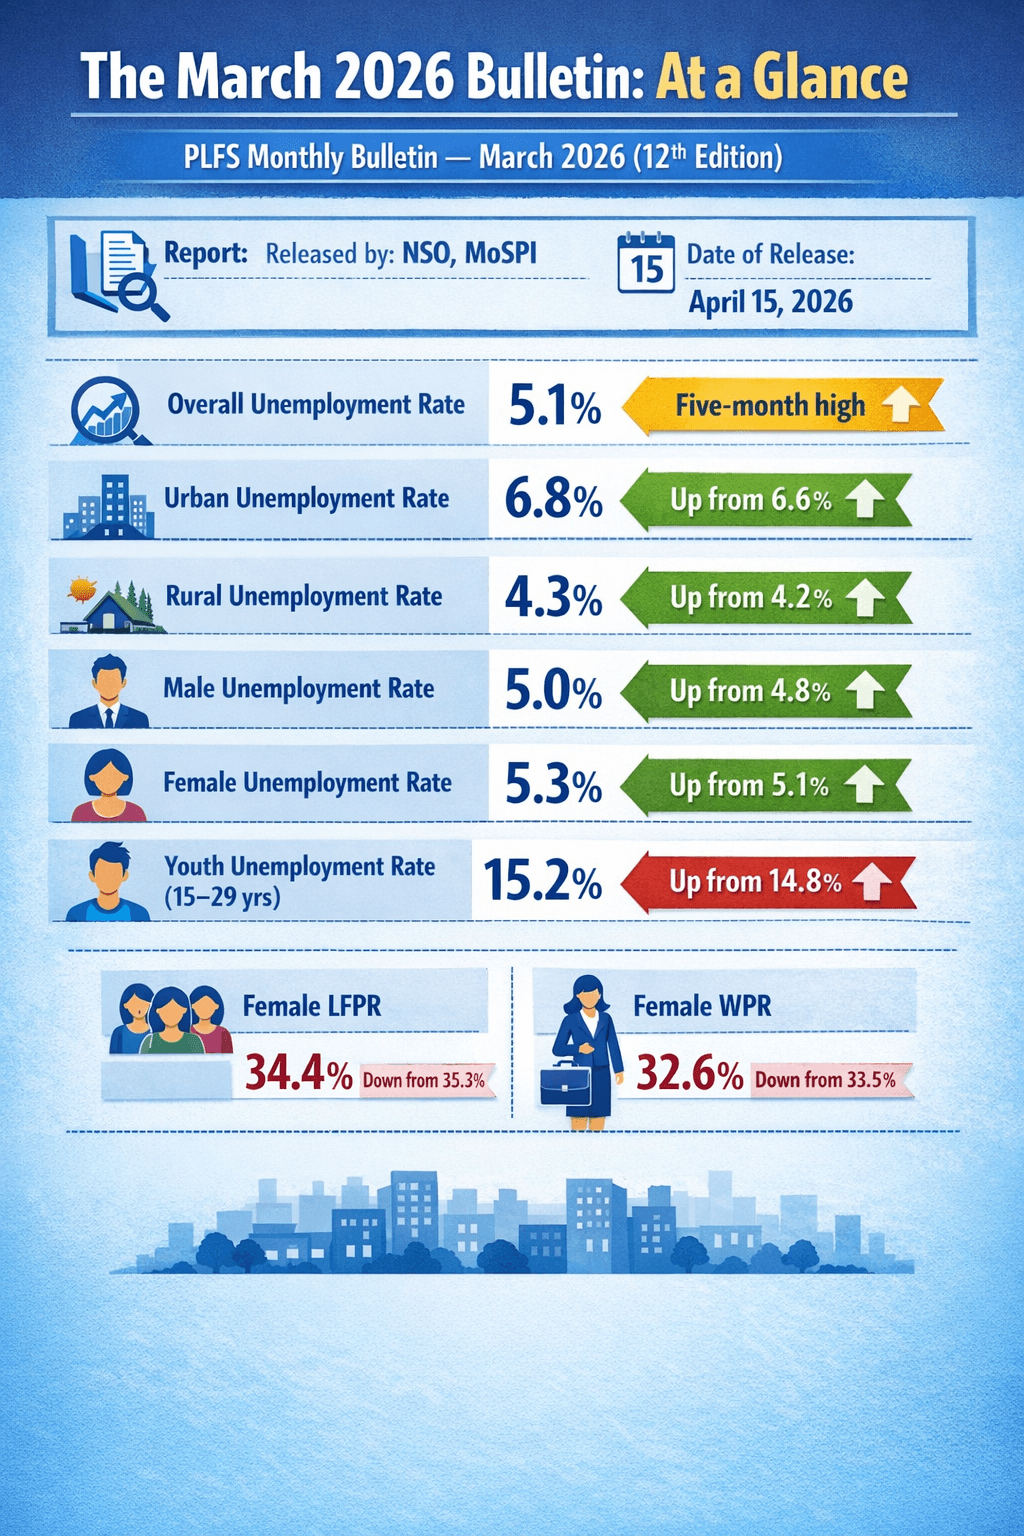
The March 2026 Bulletin: At a Glance
Article Decoding: Three Layers Beyond the Headline
What the Numbers Say, What They Imply, and What They Conceal
Layer 1 — The Urban Story: Formal Sector Caution
- The headline unemployment rate of 5.1% is only mildly higher than February’s 4.9%. But the urban rate rising to 6.8% tells a more important story.
- Urban labour markets are more exposed to formal-sector hiring, services demand, and business sentiment. When urban unemployment rises while rural unemployment stays almost flat, it signals that city employers are hiring more cautiously .
- This caution is consistent with the March 2026 PMI data showing India’s manufacturing growth at a 45-month low, and with services firms reporting slower expansion.
- The labour market is responding to softer economic momentum, and cities are feeling it first.
Layer 2 — The Female Withdrawal: The Hidden Deterioration
- The article mentions female WPR fell to 32.6% from 33.5%, and female LFPR dropped to 34.4% from 35.3%. These numbers deserve more attention than they receive in the headline.
- When female LFPR falls, it does not always mean women lost jobs — it often means they stopped looking for work, either because they could not find suitable employment or because social and structural barriers made job search impractical.
- A 0.9 percentage point fall in female LFPR in a single month is a significant deterioration and reflects the fragility of women’s employment gains in India’s recovery.
Layer 3 — Youth Unemployment: The Most Urgent Signal
- The article does not mention youth unemployment, but the broader PLFS data reveals that unemployment among people aged 15–29 years rose to 15.2% in March from 14.8% in February.
- Among young men it rose to 14.3% from 13.7%, and among young women it inched up to 17.7% from 17.6%.
- Youth unemployment at 15.2% in a month when overall unemployment is only 5.1% points to a structural mismatch — young people entering the labour market are not finding jobs at the pace needed.
- This is partly a skills gap, partly a formal-sector supply constraint, and partly a reflection of how slowly India’s employment-intensive sectors are absorbing new entrants.
The Big Number: The Female LFPR (34.4%)
- If one number from the March 2026 bulletin should worry policymakers most, it is 34.4% — India’s female labour force participation rate.
- At 34.4%, India’s female LFPR remains far below the global average of approximately 47%, and well below comparator economies. The fall from 35.3% in February is not catastrophic in isolation, but the trend direction is the concern.
- Female LFPR reached a peak in late 2025, and has now declined for two consecutive months.
| Group | February 2026 | March 2026 |
| Overall LFPR | 55.9% | 55.4% |
| Female LFPR | 35.3% | 34.4% |
| Rural Female LFPR | 39.8% | 38.9% |
| Urban Female LFPR | 25.6% | 25.2% |
Action Agenda: Four Reforms India’s Labour Market Needs Now
| # | Area | Problem | Solution | Why It Matters |
| 1 | Labour Measurement | CWS counts anyone who worked even one hour as employed — underemployment and low-wage informal work are invisible in the data | Introduce a complementary underemployment index tracking hours worked, wages, and job quality alongside the standard unemployment rate | A labour market that looks healthy on the surface but hides widespread underemployment is not a healthy labour market |
| 2 | Rural Labour Monitoring | Rural unemployment at 4.3% looks stable, but falling rural LFPR and WPR show workers quietly exiting the workforce rather than finding better jobs | Build targeted monitoring of rural labour transitions, especially in rain-dependent agricultural states, to distinguish seasonal withdrawal from structural distress | Catching rural labour stress early prevents it from deepening into an irreversible structural problem |
| 3 | Gig and Informal Worker Coverage | PLFS household surveys cannot adequately capture gig workers, seasonal migrants, platform workers, or contract labourers — India’s fastest-growing employment categories | Create a digital registration system for informal and gig workers linked to social protection benefits, improving both data quality and worker welfare | India’s most vulnerable workers are also its least counted — fixing the data gap and the protection gap must happen together |
| 4 | Time Series Stability | PLFS monthly methodology was revised only in January 2025, making the series less than 15 months old — single-month readings carry high volatility risk | Invest in extending and stabilising the monthly PLFS series so short-term fluctuations can be separated from genuine structural trends | Good policy requires good data, and good data requires continuity — reacting to one month’s reading without context risks both over- and under-response |
What to Watch
The immediate priority is urban job creation in sectors that employ women, young workers, and low-skilled labour — construction, logistics, retail, and light manufacturing. The RBI faces a difficult trade-off: softening employment argues for rate cuts, but sticky input costs constrain that space.
Three indicators to watch over the next quarter:
- Does female LFPR recover above 35%?
- Does youth unemployment plateau or keep rising?
- Does urban unemployment cross 7%?
If all three move in the wrong direction simultaneously, the conversation will shift from “softening” to “structural concern.”
- Sign Up on Practicemock for Updated Current Affairs, Topic Tests and Mini Mocks
- Sign Up Here to Download Free Study Material
Free Mock Tests for the Upcoming Exams
- IBPS PO Free Mock Test
- RBI Grade B Free Mock Test
- IBPS SO Free Mock Test
- NABARD Grade A Free Mock Test
- SSC CGL Free Mock Test
- IBPS Clerk Free Mock Test
- IBPS RRB PO Free Mock Test
- IBPS RRB Clerk Free Mock Test
- RRB NTPC Free Mock Test
- SSC MTS Free Mock Test
- SSC Stenographer Free Mock Test
- GATE Mechanical Free Mock Test
- GATE Civil Free Mock Test
- RRB ALP Free Mock Test
- SSC CPO Free Mock Test
- AFCAT Free Mock Test
- SEBI Grade A Free Mock Test
- IFSCA Grade A Free Mock Test
- RRB JE Free Mock Test
- Free Banking Live Test
- Free SSC Live Test