

All those candidates who are eyeing exams like RBI, SEBI, or NABARD exams will have to stay updated with all the important economic and regulatory updates. In today’s edition of Vishleshan, we’ll discuss How We Lost in Calculation and What Everyone Gets Wrong About GDP. These issues are highly relevant for all the upcoming competitive exams mentioned above. Keep reading to stay ahead with a clear understanding of today’s topic.
Lost in Calculation: What Everyone Gets Wrong About GDP
Context: India’s GDP data is often misunderstood, leading to flawed debates. This piece demystifies the process, explaining why the GDP deflator differs from CPI and why the estimates are robust, shifting focus from statistics to real economic challenges.
Source: Mint
The article by former Chief Statistician of India, T.C.A. Anant, deconstructs the common misconceptions surrounding India’s GDP data and the perceived inconsistencies between different price measures. He argues that the debate over “statistical fudging” and a “low” GDP deflator stems from a fundamental misunderstanding of how GDP is estimated and how different inflation indices (like the Consumer Price Index (CPI) and Wholesale Price Index (WPI)) measure different aspects of the economy. The article highlights that the divergence between these indices is not unique to India but a global phenomenon and is a result of structural differences in their baskets, specifically the varying weight of tradable and non-tradable goods. The author concludes that while India’s overall growth is robust, the low deflator is a crucial signal of persistent weakness in the manufacturing sector, a real challenge that is often obscured by the debate over data credibility.
Gross Domestic Product (GDP):
Gross Domestic Product (GDP) is the total monetary value of all the finished goods and services produced within a country’s geographical boundaries during a specific period, typically a year or a quarter. It’s the most widely used metric to gauge the size and health of an economy.
Significance:
- Economic Health Indicator: GDP growth rate is the primary indicator of an economy’s performance. A rising GDP generally indicates a healthy economy with increased employment and income, while a falling GDP can signal a recession.
- Policy Formulation: Governments and central banks use GDP data to formulate economic policies. For instance, if GDP growth is slow, the government might increase public spending or the central bank might lower interest rates to stimulate the economy.
- International Comparison: GDP is used to compare the economic output and living standards of different countries.
- Business and Investment Decisions: Businesses and investors use GDP data to forecast economic conditions and make strategic decisions about expansion or investment.
Approaches to Calculate GDP:
There are three main approaches to calculating GDP, which, in theory, should yield the same result:
- Expenditure Approach: This method sums up all spending on final goods and services in an economy.
GDP = C + I + G + (X−M)
- C: Consumption (household spending)
- I: Investment (business spending on capital goods and inventory)
- G: Government Spending
- (X-M): Net Exports (exports minus imports)
2. Income Approach: This approach calculates GDP by adding up all income earned within the economy.
- GDP = Wages + Rent + Interest + Profits + Indirect Taxes − Subsidies
3. Production (or Value-Added) Approach: This method calculates the total value added at each stage of production to avoid double-counting.
- Value Added: The value of a firm’s output minus the value of the intermediate goods it purchased.
- GDP = Sum of Value Added in all sectors
GDP at Current and Constant Prices:
- GDP at Current Prices (Nominal GDP): This measures the value of goods and services produced in an economy using the prices of the current year. Changes in nominal GDP can be due to either a change in the quantity of goods and services produced or a change in their prices (inflation/deflation).
- GDP at Constant Prices (Real GDP): This measures the value of goods and services using prices from a fixed base year. By keeping prices constant, real GDP only reflects changes in the volume or quantity of output. It is a more accurate measure of an economy’s real growth.
- Methodology and Deflator: Real GDP is calculated by adjusting nominal GDP for price changes using a GDP deflator. The deflator is an index that measures the change in prices of all goods and services produced in an economy.
Real GDP = (Nominal GDP / GDP Deflator) × 100
The article explains that in India, a mix of both nominal and constant-price estimates are used. For sectors with detailed accounting data (like corporate and government), statisticians start with nominal values and then “deflate” them to get constant-price estimates. For other sectors like agriculture and construction, they often start with quantitative or volume-based data to estimate “constant-price” growth, which is then “inflated” to get nominal values.
Decoding the Article’s Key Issues:
The article tackles two major misconceptions about India’s GDP data:
1. The Confusion over “Which Comes First?”
- Misconception: Many believe that GDP is always first estimated in nominal terms and then converted to real terms using a deflator.
- Reality: The article clarifies that this is not always the case. For about two-thirds of annual GDP estimates, the process starts with current-price data, which is then deflated. However, for a significant part of the economy (e.g., agriculture and unorganised sectors), estimates often start with volume-based indicators, meaning the constant-price data is the primary estimate, which is then inflated to get the nominal value. This distinction is crucial, as the article points out: where constant-price estimates are inflated forward, a low deflator would actually understate, not overstate, real GDP growth.
2. The Divergence between CPI and GDP Deflators
- Misconception: The article addresses the recurring charge that India’s GDP data is suspect because the GDP deflator and CPI inflation behave very differently. For example, in the first quarter of 2025-26, real GDP grew 7.8% while nominal GDP grew 8.8%, implying a GDP deflator of only 0.9%, which seems “too low” compared to CPI inflation.
- The “Why”: Structural Differences in the Baskets: The article explains that this divergence is not an anomaly but a global phenomenon due to the different compositions of these indices.
- WPI’s Dominance of Tradables: The Wholesale Price Index (WPI), which is a major input for the GDP deflator, is heavily dominated by tradables (globally traded goods), making up 80-85% of its basket. When global commodity prices fall, these disinflationary pressures are directly transmitted into India’s WPI, causing it to be low or even negative.
- CPI’s Focus on Non-tradables: The Consumer Price Index (CPI), on the other hand, has a different basket. Only 35-40% of its basket consists of tradables, with the majority being non-tradables like services, housing, education, and health. These are largely insulated from global price cycles and are more influenced by domestic factors like food prices.
- The “How” it Affects the Economy: This divergence has real consequences. The article argues that India is effectively “importing global disinflation” through its wholesale prices. While this seems beneficial, the fact that CPI inflation remains positive means the RBI, in its inflation-targeting regime, has to maintain high interest rates to contain domestic, non-tradable inflation. These high interest rates make it harder for Indian manufacturers, who operate in globally competitive tradable markets, to compete with lower-cost imports.
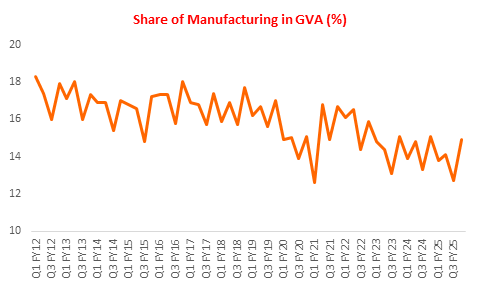
The author concludes that the real issue is not the credibility of the statistical system but the interpretation of the data. The low GDP deflator is not a sign of data manipulation but a signal of an underlying economic challenge: strong overall growth driven by services and construction, but persistent weakness and pricing pressures in the manufacturing sector.
- Sign Up on Practicemock for Updated Current Affairs, Topic Tests and Mini Mocks
- Sign Up Here to Download Free Study Material
Free Mock Tests for the Upcoming Exams
- IBPS PO Free Mock Test
- RBI Grade B Free Mock Test
- IBPS SO Free Mock Test
- NABARD Grade A Free Mock Test
- SSC CGL Free Mock Test
- IBPS Clerk Free Mock Test
- IBPS RRB PO Free Mock Test
- IBPS RRB Clerk Free Mock Test
- RRB NTPC Free Mock Test
- SSC MTS Free Mock Test
- SSC Stenographer Free Mock Test
- GATE Mechanical Free Mock Test
- GATE Civil Free Mock Test
- RRB ALP Free Mock Test
- SSC CPO Free Mock Test
- AFCAT Free Mock Test
- SEBI Grade A Free Mock Test
- IFSCA Grade A Free Mock Test
- RRB JE Free Mock Test
- Free Banking Live Test
- Free SSC Live Test