

Bar Graph Data Interpretation (DI) is an important component of the Quantitative Aptitude section in the IBPS RRB PO 2025 exam. Usually, there are 10-15 DI questions in both Prelims and Mains, mastering Bar Graph DI can increase your score significantly. This article provides a brief guide on how to efficiently solve Bar Graph DI questions within 3 minutes, designed for RRB PO 2025 aspirants.
IBPS RRB PO Free Topic Tests
Here we are providing the IBSP RRB PO free Topic test for the reasoning and quant sections. Candidates can click the link below and attempt the questions.

Free Study Resources To Crack the IBPS RRB PO 2025 Exam
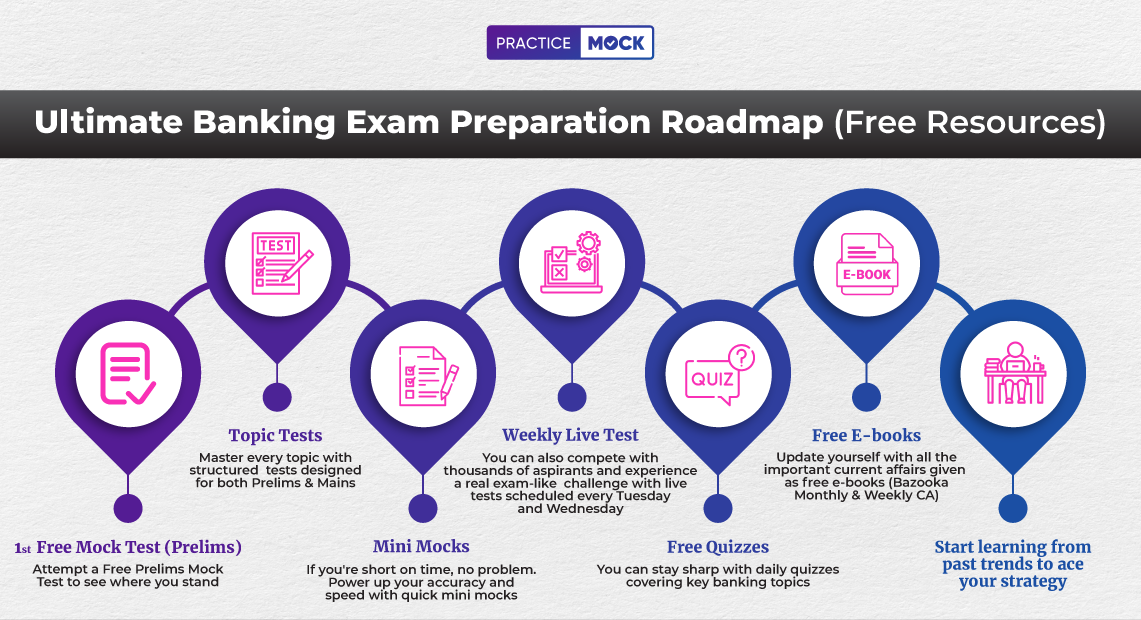
To crack the IBPS RRB PO 2025 exam, candidates can start preparation with our free study resources like mock tests, topic-wise tests, and mini mocks to enhance their accuracy and speed. Attend weekly live tests to get a real exam-like experience and compete with peers. Stay updated with daily quizzes and free eBooks on current affairs. Analyse past trends to create a winning exam strategy.
| Topics | RRB PO Preparation Resources |
| Free Full-Length Mock Test | RRB PO Free Full-Length Mock Test |
| Reasoning Free topics tests | RRB PO Reasoning Free Topic Test |
| Quant Free Topic Tests | RRB PO Quant Free Topic Test |
| Previous Year Paper | 2017 To 2024 Question PDFs |
| Ebooks PDF | Download Free PDFs |
| Weekly Live Test | Every Tuesday to Wednesday, from 10 PM to 5 PM |
Understanding Bar Graph DI
Bar graphs represent data using rectangular bars, where the length or height of each bar corresponds to the data value. In RRB PO exams, bar graphs often depict categories such as sales, population or performance metrics across years, regions or groups. Questions may involve calculations such as percentages, ratios, averages or differences based on the given data.
Key features of a bar graph:
- Axis: The x-axis typically shows categories (e.g., year, product), and the y-axis shows values (e.g., sales in thousands).
- Type: Vertical or horizontal bars, single or multiple datasets (stacked or grouped bars).
- Data: This may include absolute values, per
Why speed matters
In the RRB PO preliminary exam, the Quantitative Aptitude section has 40 questions to be solved in 20 minutes, allowing around 30 seconds for each question. The DI set, which consists of 4-5 questions, requires quick data extraction and calculations for maximum attempts. Solving the Bar Graph DI set in 3 minutes allows you to allocate time for other questions.
Bar Graph DI Important Questions For RRB PO
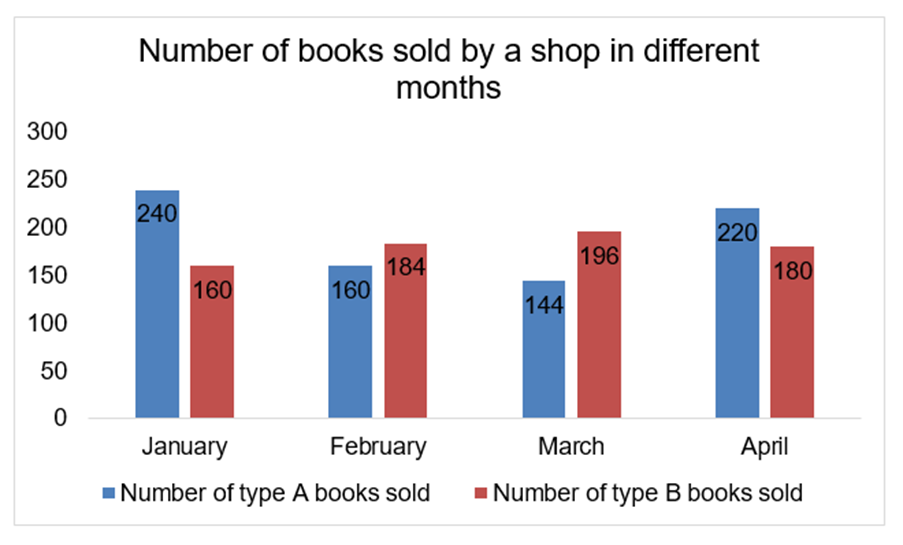
The bar graph below provides information about the number of books of two types i.e. type A and type B sold by a shop in different months of a year.
Note: Total number of books sold in any month = Number of books sold of type A sold in that month + Number of books sold of type B sold in that month
Question 1: Find the average number of type A books sold by the shop in the 4 given months.
A) 197
B) 194
C) 187
D) 191
E) None of these
Question 2: Find the ratio of the total number of books sold in the month of February to the number of books sold in the month of March.
A) 76:75
B) 86:85
C) 64:63
D) 47:42
E) None of these
Question 3: The number of type B books sold in April was what percentage of the total number of type B books sold in all the given months taken together?
A) 33.33%
B) 25%
C) 27.42%
D) 38.25%
E) 35%
Question 4: Find the difference between the total number of books sold in January and April combined and the total number of books sold in February and March combined.
A) 120
B) 124
C) 116
D) 106
E) None of these
Question 5: If the total number of books sold in May was 25% more than the total number of books sold in March, then find the number of books sold in May by the shop.
A) 425
B) 500
C) 430
D) 475
E) None of these
Step-by-Step Strategy to Solve Bar Graph DI in 3 Minutes
We are providing a step-by-step strategy to solve Bar Graph Data Interpretation questions in 3 minutes. Candidates should follow this strategy to enhance their performance.
1. Scan the Graph (30 Seconds)
- Understand axes: Identify what the x-axis (categories) and y-axis (values) represent. Note the units (e.g., thousands, millions).
- Check notes: Look for additional information, such as total values or percentage distributions, which are often provided below the graph.
- Recognise patterns: Quickly observe trends, such as which category has the highest/lowest value or significant differences between bars.
Example: A bar graph shows sales (in lakhs) of Company X across 2013–2016. The x-axis lists years, and the y-axis shows sales. A note states the total sales across all years is 400 lakhs.
2. Read Questions First (30 Seconds)
- Quickly read 4-5 questions to prioritise easy questions (e.g., direct price comparisons) over complex calculations (e.g., percentage increase).
- Identify recurring data points (e.g., sales in a specific year) to focus on the relevant ones.
Example Question: What is the percentage increase in sales from 2014 to 2015?
3. Extract Data and Calculate (1 Minute 30 Seconds)
- Write down key values: Write down the values from the bars that correspond to the questions to avoid having to double-check the graph.
- Use estimates: For percentages or ratios, write down whole numbers (e.g., 98 ≈ 100) to simplify calculations, especially if the options are different from each other.
- Apply Shortcuts:
- Percentage Increase: [(New Value – Old Value) / Old Value] × 100.
- Ratio: Simplify fractions by dividing by common factors.
- Average: Sum of values ÷ Number of categories.
- Cross-Check Units: Ensure calculations align with the graph’s units (e.g., lakhs, thousands).
Example Calculation: If sales in 2014 = 100 lakhs and 2015 = 120 lakhs:
- Difference = 120 – 100 = 20 lakhs.
- Percentage Increase = (20 / 100) × 100 = 20%.
4. Verify and Answer (30 Seconds)
- Double-check calculations for common errors (e.g., misreading bars or units).
- Match answers with options, using elimination for close values.
- Move to the next question in the set, reusing extracted data where possible.
Join our exclusive Telegram group where our experts are ready to answer all your queries, guide you in banking exam preparation, and give personalised tips to boost your success. Get access to real-time solutions, expert advice, and valuable resources to improve your study journey. [Click here to join now!]
Also Read

- Sign Up on Practicemock for Updated Current Affairs, Topic Tests and Mini Mocks
- Sign Up Here to Download Free Study Material
Free Mock Tests for the Upcoming Exams
- IBPS PO Free Mock Test
- RBI Grade B Free Mock Test
- IBPS SO Free Mock Test
- NABARD Grade A Free Mock Test
- SSC CGL Free Mock Test
- IBPS Clerk Free Mock Test
- IBPS RRB PO Free Mock Test
- IBPS RRB Clerk Free Mock Test
- RRB NTPC Free Mock Test
- SSC MTS Free Mock Test
- SSC Stenographer Free Mock Test
- GATE Mechanical Free Mock Test
- GATE Civil Free Mock Test
- RRB ALP Free Mock Test
- SSC CPO Free Mock Test
- AFCAT Free Mock Test
- SEBI Grade A Free Mock Test
- IFSCA Grade A Free Mock Test
- RRB JE Free Mock Test
- Free Banking Live Test
- Free SSC Live Test