

Data Interpretation is an important part of the quantitative section for all competitive exams like IDBI JAM. The data Interpretation questions test candidates’ ability to analyse and interpret data presented in various formats, such as tables, charts, and graphs, to solve complex problems efficiently. The IDBI JAM online examination will be conducted on 8th June 2025. Candidates understand the sample DI question types so that they can boost their quantitative aptitude section score.
IDBI JAM Study Resources 2025 Links (based on the latest Pattern)
The PracticeMock provides free preparation resources to boost section-wise preparation. Using these free resources can make a huge difference in your exam preparation and also help you save costs. Here are the main reasons why free resources are important for your preparation:
| IDBI JAM Mock Tests | Take Mock Tests |
| Reasoning Topic Tests | Take Reasoning Mock Tests |
| Quant Topic Tests | Take Quant Mock Tests |
| English Topic Tests | Take English Mock Tests |
| General Awareness Topic Tests | Take General Awareness Mock Tests |
| IDBI JAM Previous Year Question Paper PDF | |
| IDBI JAM Previous Year Question Paper | Click To Download |
| IDBI JAM Previous Year Question Paper– Solutions | Click To Download |
Sample Data Interpretation Question Types
Based on previous year question papers and exam analyses, the following DI question types are frequently asked in the IDBI JAM Exam. This data will be provided from candidate feedback and expert analyses of past exams.
1. Table-Based DI
These questions present data in tabular form, such as sales figures, population statistics, or financial data across different categories or time periods.
- Weightage: Approximately 5 questions per DI set, with 1-2 sets in the exam.
- Difficulty Level: Easy to moderate, depending on the complexity of calculations.
2. Bar Graph DI
Bar graphs DI represent data visually, comparing quantities across categories or time periods. Questions require interpreting the graph to calculate differences, percentages, or trends.
- Weightage: Around 4-6 questions per set, with 1-2 sets.
- Difficulty Level: Easy to moderate, as bar graphs are straightforward but may involve multi-step calculations.
3. Line Graph DI
Line graphs depict trends over time, such as sales growth, stock prices, or economic indicators.
- Weightage: Typically 4-6 questions per set, with 1 set.
- Difficulty Level: Moderate, as trend analysis requires careful observation.
4. Pie Chart DI
Pie charts show data distribution as percentages or proportions of a whole, such as market share or budget allocation.
- Weightage: Around 4-6 questions per set, with 1 set.
- Difficulty Level: Easy to moderate, but accuracy in percentage calculations is crucial.
5. Caselet DI
Caselet DI presents data in a paragraph format, requiring candidates to extract information and perform calculations.
- Weightage: Approximately 5 questions per set, with 1 set.
- Difficulty Level: Moderate to difficult, as it requires both comprehension and calculation.
6. Mixed DI (Combination of Graphs/Tables)
These questions combine multiple data formats, such as a table with a bar graph or a pie chart with a line graph.
- Weightage: Around 5-8 questions per set, with 1 set.
- Difficulty Level: Moderate to difficult, due to the need to synthesise data from multiple sources.
Sample Data Interpretation questions for IDBI JAM 2025 Exam
The pie chart given below shows the percentage distribution of the number of tourists who went to five different destinations in 2017. 1,250 tourists went to Paris in 2017.
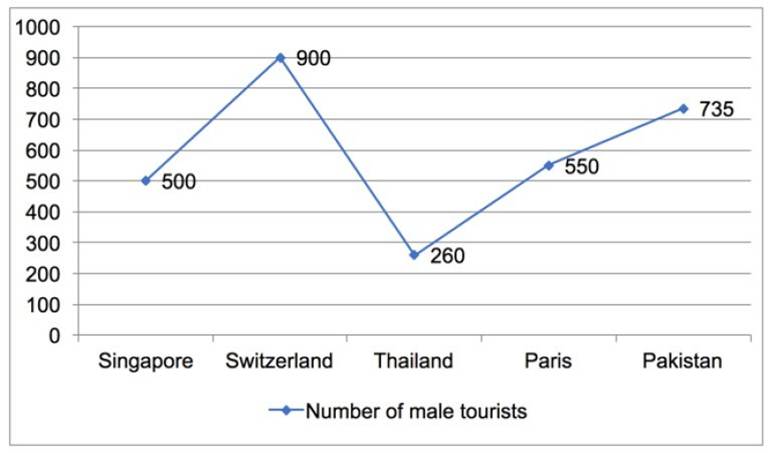
Number of male tourists who went to Singapore Switzerland, Thailand, Paris and Pakistan in 2018 are 25%, 20%, 30%, 10% and 5% more than the number of male tourists who went to Singapore, Switzerland, Thailand, Paris and Pakistan in 2017, respectively. Number of female tourists who went to Singapore, Switzerland, Thailand, Paris and Pakistan in 2018 are 40%, 20% , 30%, 20% and 25% more than the number of female tourists who went to Singapore, Switzerland, Thailand, Paris and Pakistan in 2017, respectively.
The line graph given below shows the number of male tourists who went to these five destination in 2018.
Question 1: Number of female tourists who went to Switzerland in 2017 was what percent less/ more than the number of female tourists who went to Pakistan in 2017?
- 15%
- 20%
- 25%
- 30%
- None of these
Question 2: What is the ratio of the number of female tourists who went to Paris in 2018 to the number of female tourists who went to Thailand in 2017?
- 2:1
- 3:1
- 5:2
- 5:3
- None of these
Question 3: What is the average number of male tourists who went to Switzerland, Thailand and Pakistan in 2017?
- 540
- 570
- 550
- 560
- None of these
Question 4: What is the difference between the number of tourists who went to Switzerland and Paris together in 2018 and the number of tourists who went to Thailand and Singapore together in 2017?
- 1540
- 1570
- 1610
- 1680
- None of these
Question 5: The Number of tourists who went to Singapore in 2018 is 10% more than the number of tourists who went to Japan in 2018. Find the number of tourists who went to Japan in 2017, if the number of tourists going to Japan in 2018 is 25% more than the number of tourists going to Japan in 2017.
- 680
- 700
- 720
- 750
- None of these
Preparation Strategies for DI Questions
To excel in the Data Interpretation section of the IDBI JAM 2025 exam, candidates should adopt a structured preparation approach:
Understand the exam pattern:
Review the IDBI JAM exam pattern 2025 to understand the weightage of the Logical Reasoning and Data Analysis, and Interpretation sections (60 questions). Familiarise yourself with the types of DI questions by practising previous year papers.
Practice previous year papers:
Candidates can solve IDBI JAM previous year papers to understand the trend of questions, difficulty level, and frequently asked topics.
Master calculation techniques:
Improve speed and accuracy in calculations for percentages, ratios, and averages. Learn shortcuts for multiplication, division, and approximation to save time during the exam.
Practice different DI types:
Solve table-based, bar graph, line graph, pie chart, caselet, and mixed DI questions regularly. Use resources like PracticeMock’s free mock tests or sectional quizzes to get familiar with different formats.
Take mock tests:
Attempt full-length and sectional mock tests to simulate exam conditions. Analyse your performance to identify weak areas.
Focus on time management:
Practice solving DI sets within a time limit (for example, 8-10 minutes per set). Prioritise easier sets to maximise scores and avoid getting stuck on complex questions.
Strengthen data understanding:
For caselet DI, practice reading and extracting key information quickly. Highlight relevant data points to avoid errors during calculations.
Use reliable study resources:
Access free resources like topic-wise question syllabus PDFs for targeted preparation.
Join our exclusive Telegram group, where our experts are ready to answer all your queries, guide you in banking exam preparation, and give personalised tips to boost your success. Get access to real-time solutions, expert advice, and valuable resources to improve your study journey. [Click here to join now!]

Disclaimer: This article has been prepared for informational and educational purposes only, based on previous exam trends, expert analysis, and publicly available data. It is not an official notification, and the Industrial Development Bank of India (IDBI) — the official conducting authority for the exam — has not endorsed or released the content herein. While every effort has been made to ensure accuracy, exam patterns and other details may change, and readers are advised to verify information with official IDBI updates. The practice material and insights provided are intended to support preparation and should not be considered guaranteed exam content. Neither the authors nor PracticeMock accept responsibility for any discrepancies, errors, or outcomes arising from reliance on this article. For official information, please refer to the notifications released by IDBI.
- Sign Up on Practicemock for Updated Current Affairs, Topic Tests and Mini Mocks
- Sign Up Here to Download Free Study Material
Free Mock Tests for the Upcoming Exams
- IBPS PO Free Mock Test
- RBI Grade B Free Mock Test
- IBPS SO Free Mock Test
- NABARD Grade A Free Mock Test
- SSC CGL Free Mock Test
- IBPS Clerk Free Mock Test
- IBPS RRB PO Free Mock Test
- IBPS RRB Clerk Free Mock Test
- RRB NTPC Free Mock Test
- SSC MTS Free Mock Test
- SSC Stenographer Free Mock Test
- GATE Mechanical Free Mock Test
- GATE Civil Free Mock Test
- RRB ALP Free Mock Test
- SSC CPO Free Mock Test
- AFCAT Free Mock Test
- SEBI Grade A Free Mock Test
- IFSCA Grade A Free Mock Test
- RRB JE Free Mock Test
- Free Banking Live Test
- Free SSC Live Test